WCS-WTI SPREAD
STRATEGY
Modeling crude oil price differentials using statistical distributions
// Overview
This project models the WTI-WCS crude oil differential as a normally distributed random variable and builds a mean reversion trading strategy around it. The differential is standardized into a Z-score to objectively measure how extreme the spread is on any given day relative to its historical mean. When the Z-score exceeds 2, we enter a long position betting on mean reversion, and exit when it drops back below 1.
// Background
WTI (West Texas Intermediate) is the global benchmark crude price. WCS (Western Canada Select) is Alberta's heavy oil blend, which always trades at a discount to WTI due to its lower quality and landlocked geography. This discount is called the differential. While the differential has a long run average of around $15/barrel, it can blow out significantly during periods of pipeline congestion or supply imbalances — creating potential trading opportunities.
// Methodology
Normal Distribution
The differential is modeled as a normally distributed random variable X ~ N(μ, σ²). We calculate the historical mean (μ) and standard deviation (σ) of the differential and verify visually that it follows a normal distribution.
Z-Score Standardization
Each day's differential is standardized to objectively measure how unusual the spread is on any given day relative to its historical distribution.
Poisson Distribution
Blowout events (days where Z > 2) are modeled as a Poisson process with parameter λ — the average number of blowout days per month. This quantifies how frequently extreme spread events occur.
Mean Reversion Backtest
- →Entry: Z > 2 — spread is abnormally wide
- →Exit: Z < 1 — spread has normalized
- →Profit: entry price minus exit price ($/barrel)
// Results
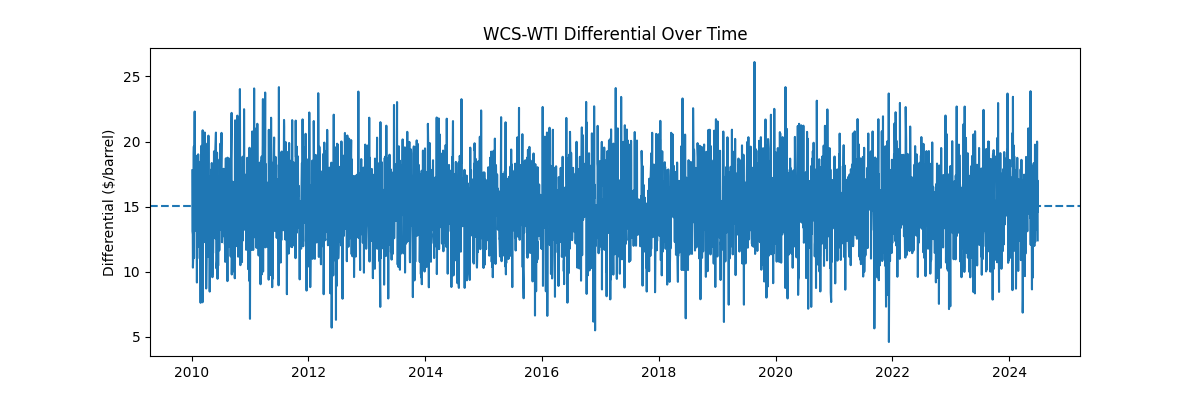
WCS-WTI Differential Over Time
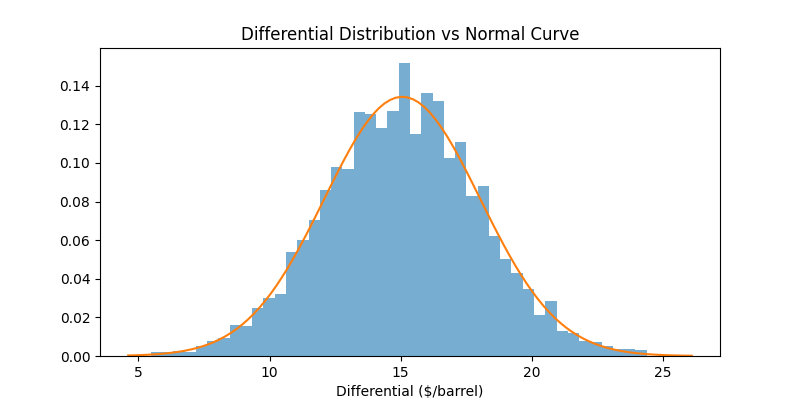
Differential Distribution vs Normal Curve
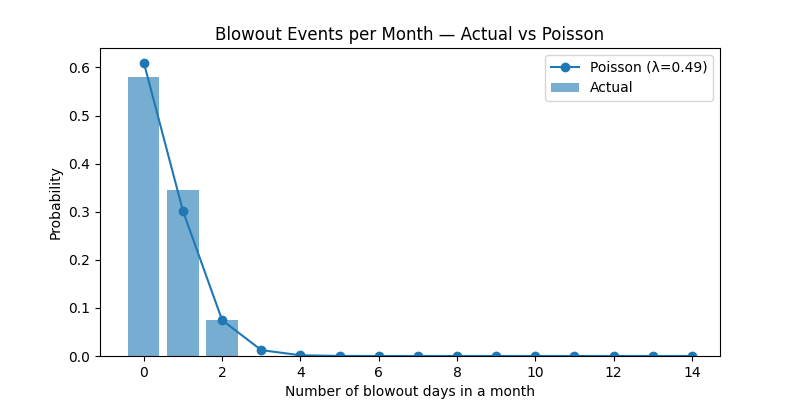
Blowout Events per Month — Actual vs Poisson
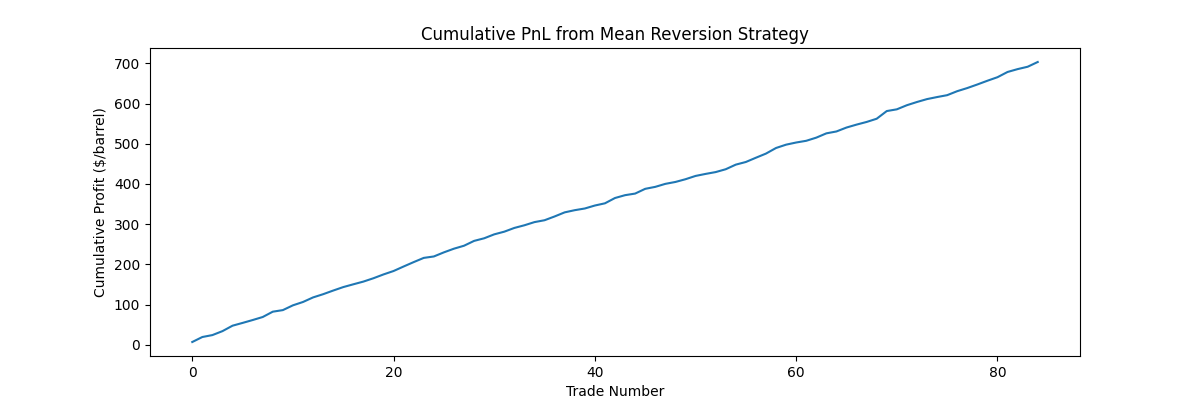
Cumulative PnL from Mean Reversion Strategy